/ use-cases / monitor-vercel-app
How to monitor your Vercel app
Vercel tells you about builds and functions, not whether your site answers. Here is what to monitor and how to set it up in minutes.
Why Vercel's own signals are not uptime monitoring
Vercel's dashboard is genuinely useful for what it is built for: understanding how your deployment behaves once it is already getting traffic. Its Observability tab tracks events generated by requests that reach your app — edge requests, Vercel Function invocations, external API calls, Incremental Static Regeneration — and its error-anomaly alerts fire when a route's five-minute error rate is unusually high against its own trailing 24-hour baseline, gated behind a minimum-activity threshold so a low-traffic route does not create noise. Web Analytics, separately, counts real visitor pageviews. All three presuppose that a request already landed on your app.
None of it is an independent check that originates outside Vercel's own network and hits your public URL on a fixed schedule, regardless of whether a real visitor showed up — which is what uptime monitoring actually means. If DNS breaks, if a region cannot route to your deployment, or if the app is simply down and getting zero traffic, there is no request stream for Observability to analyze and no baseline for an anomaly to deviate from.
Vercel's own status page is a different signal again: it reports the health of Vercel's platform infrastructure — the build and deploy pipeline, the API, edge nodes by region — not the availability of any single customer's app. A fully green status page and a broken deployment are not mutually exclusive.
None of this is a knock on Vercel's own tooling; it is built for debugging your code once you already know something is wrong, not for finding out that something is wrong in the first place. Check what your specific plan's alerting actually covers before assuming it closes that gap — some of the deeper observability features are gated to paid tiers.
What is worth monitoring
For an app hosted on Vercel, the checks worth setting up sit outside anything Vercel's own build pipeline can see:
- The production domain itself over HTTPS — the URL your users actually type or click, not
only the
*.vercel.appdeployment alias. - Any custom domain pointed at the deployment, since its DNS records and registrar sit outside Vercel entirely and can drift without anything appearing in the Vercel dashboard.
- The TLS certificate on that custom domain, checked separately from the HTTP response — an HTTP check that only verifies the certificate is currently valid will not warn you before it expires, which is a distinct kind of check.
- Individual API routes the app depends on for core functionality, if they are distinct enough from the homepage that a homepage-only check could stay green while they fail underneath it.
Checking from more than one place matters too. Vercel's edge network serves static assets and functions from data centers close to each visitor, but the network path a visitor's ISP takes to reach that edge, and whether the domain's DNS resolves cleanly, can still vary by region in ways a single vantage point will not show.
How to set it up in Fettle
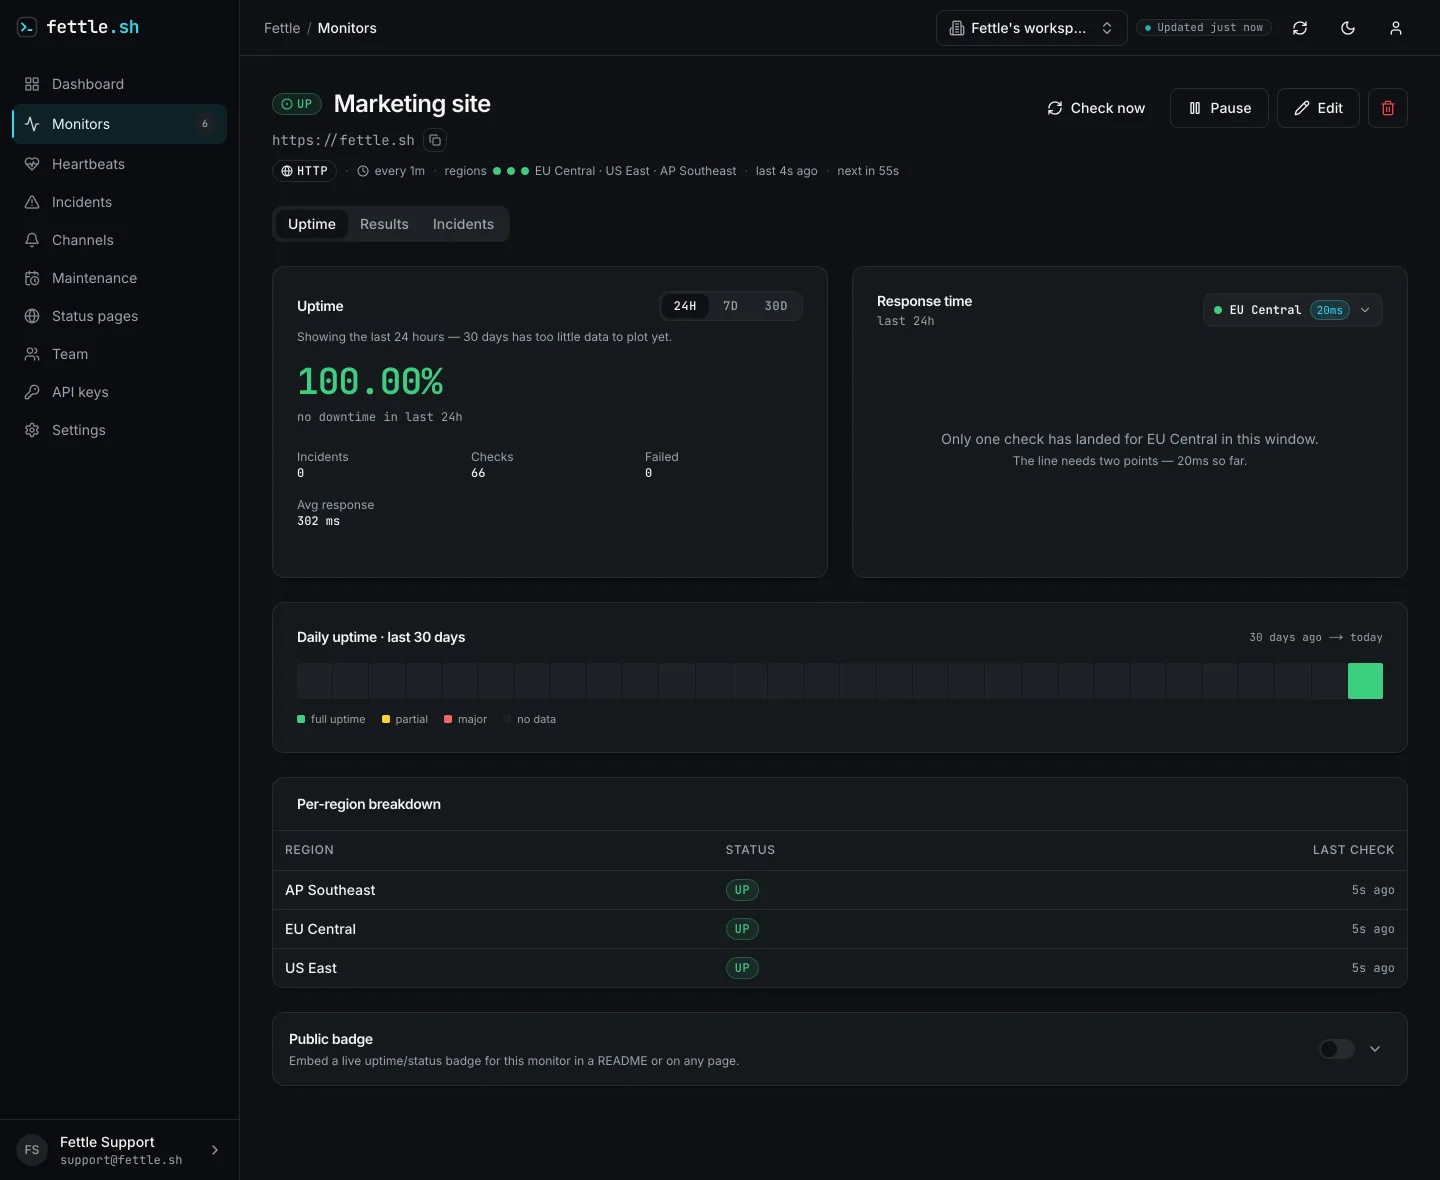
- Create an API key with write scope from Settings → API Keys, or skip the API entirely and add monitors straight from the dashboard.
- Add an HTTP monitor pointed at the production domain — not the
*.vercel.appalias — and check it from at least two regions across Europe, the US and Asia, so a bad path in one region does not read as the whole site being down. - If the app sits behind a custom domain, add a second monitor of type SSL against the same host, with a warning window set early enough to renew or rotate the certificate before it actually expires.
- The same setup works from the API. This creates the HTTP monitor from step 2:
curl -s -X POST https://api.fettle.sh/v1/monitors \
  -H "Authorization: Bearer fettle_your_key_here" \
  -H "Content-Type: application/json" \
  -d '{
        "name": "Production (Vercel)",
        "type": "HTTP",
        "target": "https://my-app.vercel.app",
        "interval_seconds": 60,
        "timeout_seconds": 10,
        "regions": ["eu-central", "us-east"]
      }'
interval_seconds has a plan floor — 120 on the free plan, 60 on the paid tiers below the
top one — and regions is capped by plan too. Try the same idea against your own domain,
without creating anything, on the multi-region check tool first.
The full walkthrough for creating a key and reading results back is in the
quickstart guide.
Prefer an MCP-aware client to raw curl? Point it at the same account with this one-liner:
{
  "mcpServers": {
    "fettle": {
      "url": "https://api.fettle.sh/mcp",
      "headers": { "Authorization": "Bearer fettle_your_key_here" }
    }
  }
}
Which alerts to wire
A monitor that only sits in a dashboard is not much better than the Vercel dashboard it is meant to back up. Fettle sends alerts by email, Slack, Telegram or a generic webhook — wire whichever channel your team already gets paged on for production incidents, not a Vercel-specific one, since the point is catching the outages Vercel's own tooling structurally cannot see.
Two habits keep the noise down. First, use a maintenance window around planned redeploys or domain cutovers, so a deliberate few minutes of downtime during a DNS change does not fire a false alert. Second, if the app is public-facing, put a status page in front of the monitor — Vercel's own status page will stay green through an outage that is specific to your app, so your users need somewhere else to check. How many monitors, regions and status pages come with each plan is on the pricing page.
Questions
- Does Vercel already monitor uptime for me?
- Vercel's dashboard reports on builds, function invocations and traffic your deployment already received, and its own status page tracks Vercel's platform, not your app. Neither is an independent check hitting your live URL on a schedule.
- How fast can Fettle check a Vercel app?
- The free plan requires at least 120 seconds between checks. Paid plans allow 60 seconds, and the top tier allows 30 seconds. Pick the shortest interval your plan allows for a production domain.
- Can I monitor a Vercel preview deployment?
- Yes — a preview URL is an ordinary HTTPS endpoint, so an HTTP monitor works the same way it does for production. Remove the monitor once the preview deployment is gone.
Start monitoring in a minute
The free plan checks up to 20 monitors as often as every 2 minutes from 2 regions, and emails you when one breaks. See pricing for the paid intervals, or follow the quickstart to do it from the API.