/ use-cases / monitor-fly-app
How to monitor your Fly app
Fly's health checks decide routing per region, not whether your app is up everywhere. Here is what to monitor across regions and how to set it up.
Why Fly's own signals are not uptime monitoring
Fly.io gives an app real, load-bearing health checks that decide whether the Fly Proxy sends
traffic to a given Machine. Configure an HTTP or TCP check in
fly.toml and Fly polls it continuously, not only during a deploy. If a Machine fails its check,
Fly's own documentation is direct about the consequence — it "will be marked as unhealthy by the
proxy, and it won't be routed to until its checks start passing." That is genuinely useful
routing logic.
It is also, by Fly's own account, not a monitoring or remediation system. The same documentation states plainly that "your Machines won't automatically restart or stop due to failing their health checks, this needs to be done manually." A health check changes routing, not machine state — and it changes routing for one Machine in one region, not for your app as a whole.
That per-Machine, per-region scope is the part worth sitting with. Fly apps run as Machines placed in specific regions, and the Fly Proxy relies on Anycast networking so that "your users in Tokyo, São Paulo, or Amsterdam connect to the nearest server" automatically. That is excellent for latency and mostly invisible when it works. But it means a health check passing in one region says nothing about whether the deploy is healthy in another — a bad release, a misconfigured secret, or a dependency outage that only affects one region can leave Anycast quietly routing some users to a working Machine and others to a broken one, with nothing in Fly's own dashboard phrased as "your app is down for part of your traffic."
Fly Machines can also autostop when idle and autostart on the next request, a feature aimed at cost, not availability. Fly's docs describe a "stop loop" that runs periodically per region and an autostart path that "should automatically start Machines based on requests and capacity" when enabled. That is a deliberate, documented behavior, and it is also a second reason a from-outside check needs to be read carefully: a cold start after idle time is not the same event as an outage, even though both can show up as a slow or failed first response if you are not expecting it.
None of this is a shortfall in Fly's tooling — health checks that gate routing per-Machine and an autostop/autostart system that saves cost on idle capacity are both doing exactly their documented job. Neither one is an independent, scheduled check of whether your app actually answers from the outside, from more than one place, regardless of which Machine happens to be up.
What is worth monitoring
For an app running on Fly, the checks worth adding are the ones Fly's own routing and health system was never built to answer:
- The app's public hostname over HTTPS, checked from more than one region — since Anycast can route different visitors to different Machines, a single check from a single vantage point can stay green while a specific region's path is actually broken.
- Any custom domain pointed at the app, since its DNS and registrar sit outside Fly and can drift
with nothing surfacing in
fly statusor the Fly dashboard. - The TLS certificate on that custom domain, checked on its own — an HTTP check that confirms the certificate is currently valid will not warn you before it is close to expiring, which is a distinct concern from whether the app answers right now.
- A response-time baseline, so a slow first response after a Machine autostarts from idle reads as an expected cold start rather than a genuine timeout from a stuck process.
- Any worker process running as its own Fly Machine without a public HTTP listener — a queue consumer, a scheduled job — which an HTTP check cannot reach at all regardless of region.
Checking from multiple regions is not optional polish here the way it can be on a single-region host; it is the direct counterpart to how Fly itself is architected. A Fly deploy that spans regions is, from the outside, only as observable as the number of vantage points asking it "are you answering" from each of those regions independently.
How to set it up in Fettle
- Create an API key with write scope from Settings → API Keys, or add the monitor straight from the dashboard.
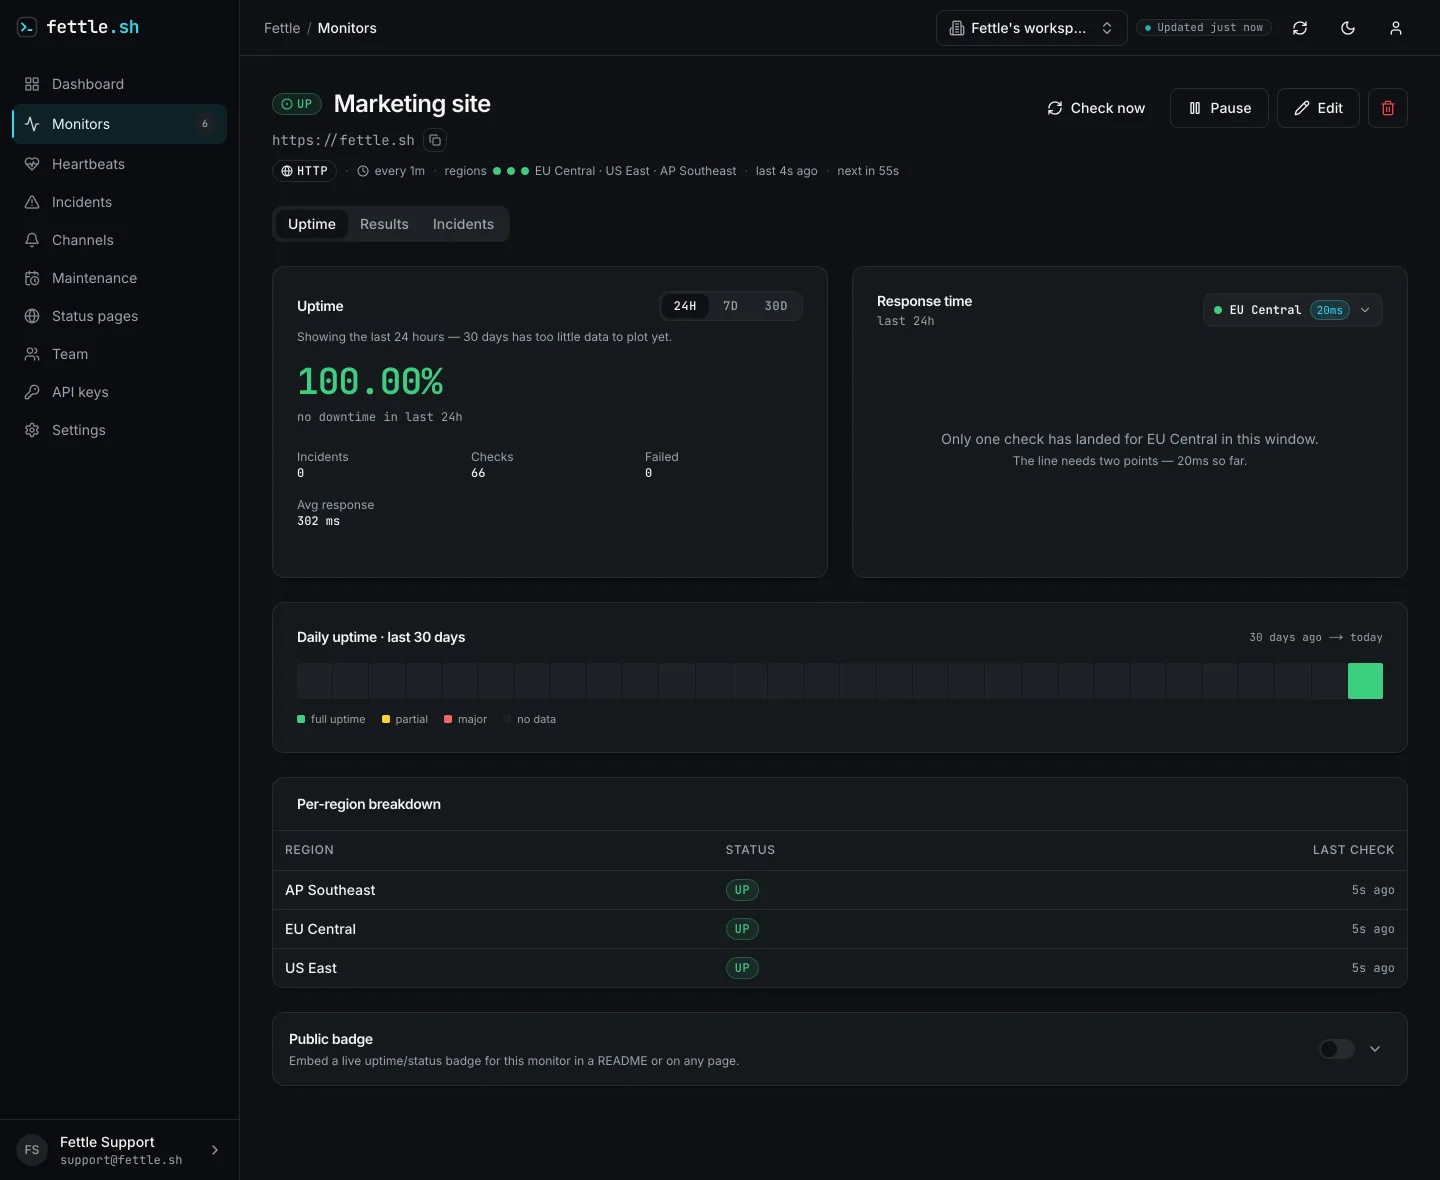
- Add an HTTP monitor against the app's public hostname, and pick check regions that match where
the Fly app actually runs Machines — a Machine in
sydneeds a check that can reach it on a realistic path, not only a check from wherever your team happens to sit. - Set the monitor's timeout with autostop/autostart in mind: if the app is configured to stop when idle, give the first request after a gap a few extra seconds — 30 is a reasonable starting point — before calling it a failure, so a routine cold start is not indistinguishable from a real timeout.
- The HTTP monitor from step 2 looks like this from the API:
curl -s -X POST https://api.fettle.sh/v1/monitors \
  -H "Authorization: Bearer fettle_your_key_here" \
  -H "Content-Type: application/json" \
  -d '{
        "name": "Production (Fly.io)",
        "type": "HTTP",
        "target": "https://my-app.fly.dev",
        "interval_seconds": 60,
        "timeout_seconds": 30,
        "regions": ["eu-central", "us-east", "ap-southeast"]
      }'
interval_seconds has a plan floor and regions a plan cap, both separate from anything Fly's
own health checks configure — those two systems don't talk to each other, which is exactly the
point of running one from outside. Try a check against your own hostname from more than one
region, without creating anything, on the multi-region check tool
first. The full walkthrough for creating a key and reading results back is in the
quickstart guide.
Prefer an MCP-aware client to raw curl? Point it at the same account with this one-liner:
{
  "mcpServers": {
    "fettle": {
      "url": "https://api.fettle.sh/mcp",
      "headers": { "Authorization": "Bearer fettle_your_key_here" }
    }
  }
}
Which alerts to wire
A Machine that fails its own Fly health check simply stops receiving traffic in that region — Fly's docs are explicit that nothing restarts or stops it automatically, so if the failure is app-level rather than transient, it can sit unrouted with no alert fired anywhere on Fly's side. Fettle sends alerts by email, Slack, Telegram or a generic webhook — wire whichever channel your team already gets paged on for production incidents, since the value of this monitor is catching exactly the failures Fly's own health checks are not designed to surface.
Two habits keep it from becoming noise. First, use a maintenance window around planned deploys or region changes, so the brief gap while new Machines come up does not fire a false alert on a monitor watching the same hostname from outside. Second, if the app is public-facing, put a status page in front of it — a Fly outage affecting only one region can otherwise be invisible to users in other regions until they hit it themselves, and a status page gives them somewhere to check instead. How many monitors, regions and status pages come with each plan is on the pricing page.
Questions
- Does Fly's health check already tell me if my app is down?
- It tells the Fly Proxy whether to route traffic to one Machine in one region. Fly's own docs say a failing check stops routing to that Machine but does not restart or stop it, and it says nothing about whether users elsewhere can reach the app at all.
- Will an external check confuse a cold start with an outage?
- Not if you give it a sane timeout. Fly's autostop/autostart docs describe starting a stopped Machine as slower than starting a suspended one; a check with a few seconds of tolerance treats a normal cold start as a normal cold start, not a false alert.
- Should I check every Fly region my app runs in?
- Only the ones that matter to your users. Fettle checks from eu-central, us-east and ap-southeast; matching a subset to where your Fly Machines actually run tells you whether a specific region's routing path is healthy, not just whether Anycast found any working Machine.
Start monitoring in a minute
The free plan checks up to 20 monitors as often as every 2 minutes from 2 regions, and emails you when one breaks. See pricing for the paid intervals, or follow the quickstart to do it from the API.