Fettlefettle.sh
FeaturesPricingToolsUse casesDocs
Sign inGet started
Fettlefettle.sh

Uptime monitoring for developers. From first deploy to incident #1000.

Product

  • Features
  • Pricing
  • Tools
  • Use cases
  • Comparisons
  • Blog
  • Docs
  • API reference
  • Status

Legal

  • Terms
  • Privacy
© 2026 Fettle. Built for developers.fettle.sh

Your stack, in
fine fettle.

Uptime monitoring that plugs into how you already work — REST API on every plan, MCP for Claude and Codex, status pages, badges. When something breaks, Fettle tells you why.

Start monitoring — freeSee pricing
Marketing siteHTTP · every 1m
EU Central96 ms
US East397 ms
AP Southeast534 ms
99.99% · last 90 days3/3 regions up

Fettle, monitoring itself — see it live: status.fettle.sh

Probes: HTTP · TCP · PING · DNS · SSL · CRON HEARTBEATSChecking from Europe · US · AsiaAlerts in email · Telegram · Slack · Discord · webhook

/ agent-native

Your agent runs it.

Fettle ships an MCP server — in the official registry. Tell Claude or Codex to add monitoring, and it happens: monitors, heartbeats, on-demand checks, incident acks. The full REST API and API keys are on every plan, including free.

remoteNothing to install
https://api.fettle.sh/mcp

Point any MCP client at it — your API key as a Bearer token.

localstdio, from npm
npx -y fettle-mcp

Works with Claude, Codex, and any MCP client. MCP setup docs → · API reference

agent session
$ claude mcp add fettle --transport http https://api.fettle.sh/mcp --header "Authorization: Bearer fettle_your_key_here"
Add uptime monitoring for fettle.sh and check it right now.
→ create_monitor target=https://fettle.sh
✓ monitor created · eu-central, us-east, ap-southeast
→ check_now
✓ UP from 3 regions · median 96 ms
→ list_incidents
✓ no open incidents — you're covered
HTTP_5XX
api.acme.dev — HTTP 503 from every region
14:02:11us-east DOWN — HTTP 503
14:02:12monitor DEGRADED — no alert yet
14:02:19eu-central DOWN — HTTP 503
14:02:24ap-southeast DOWN — HTTP 503
14:02:24unanimous → incident opened · Telegram + email sent

One flaky region never pages you — it shows as DEGRADED. An incident opens only when every region agrees your target is down.

/ signal, not noise

Alerts that say why.

Every incident carries a structured cause — timeout, DNS, TLS, 5xx, a missed heartbeat — with the failing regions and timestamps. Acknowledge to silence re-notifications; maintenance windows keep planned work from paging anyone.

/ the product

One dashboard. Yours and your agent's.

Monitors, heartbeats, incidents, maintenance, API keys — everything lives in one place. Your status page is what your users (or your clients) see.
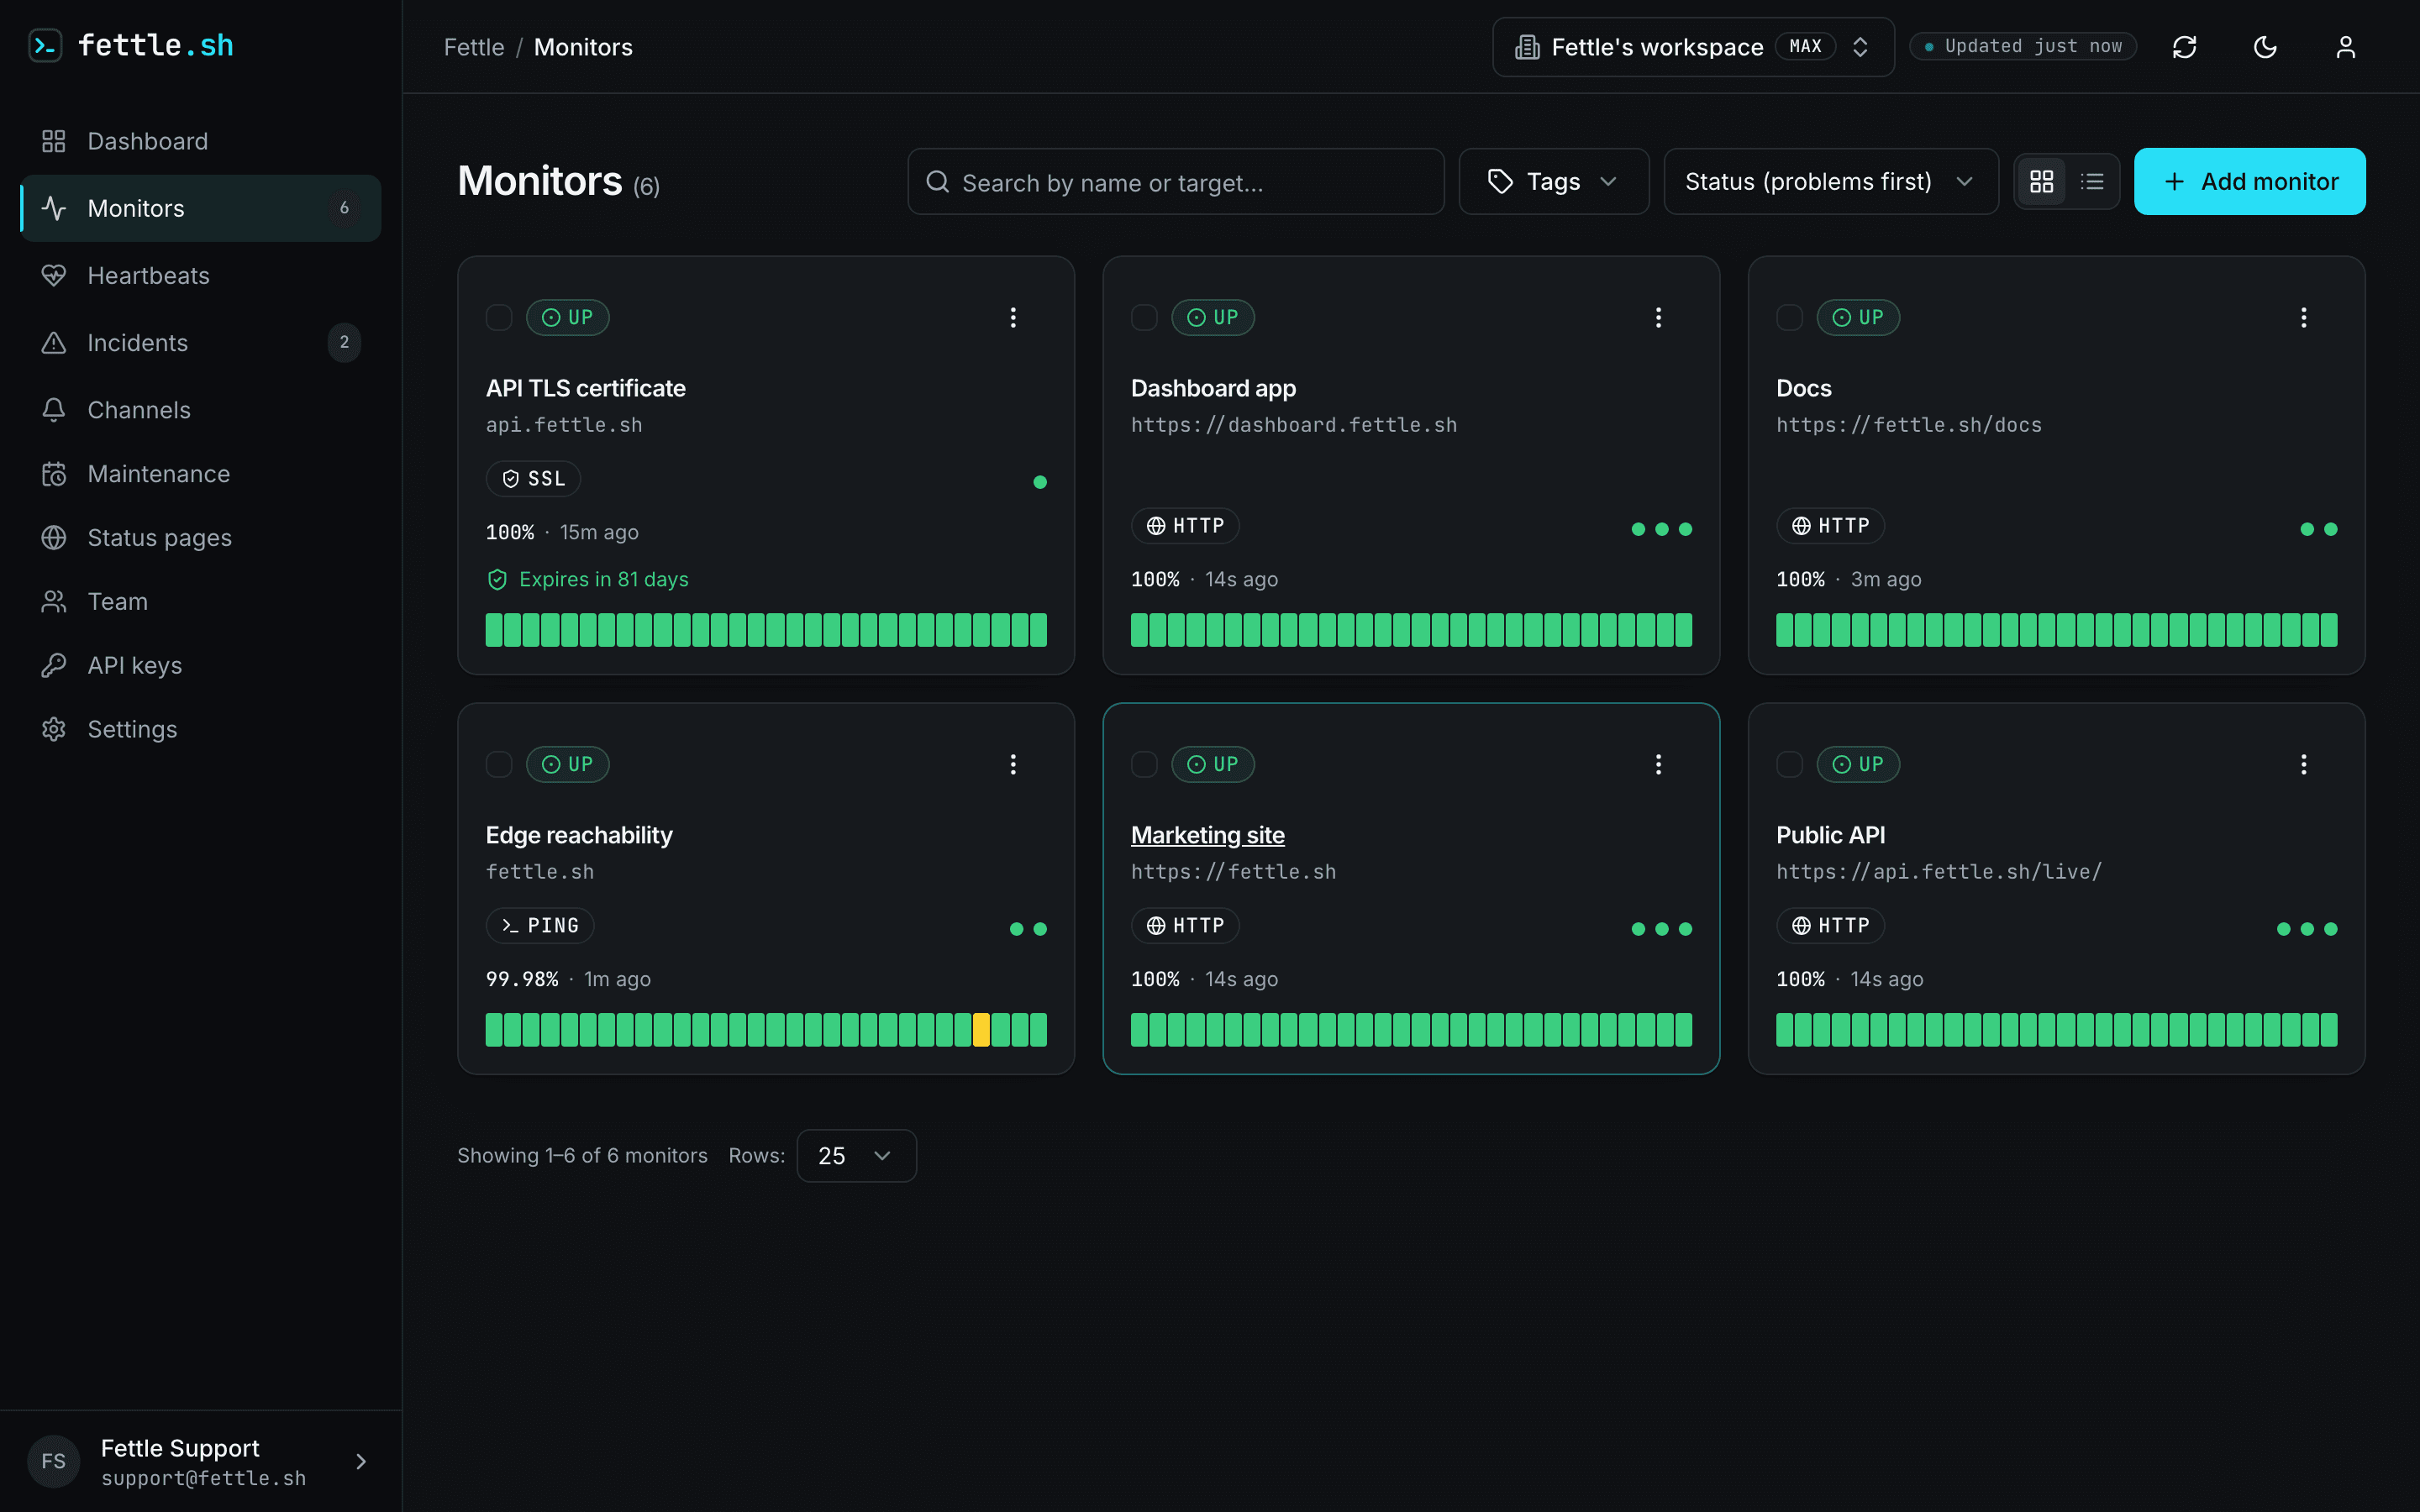
dashboard.fettle.sh/monitors
Fettle monitors dashboard: monitor list with per-region status and uptime strips
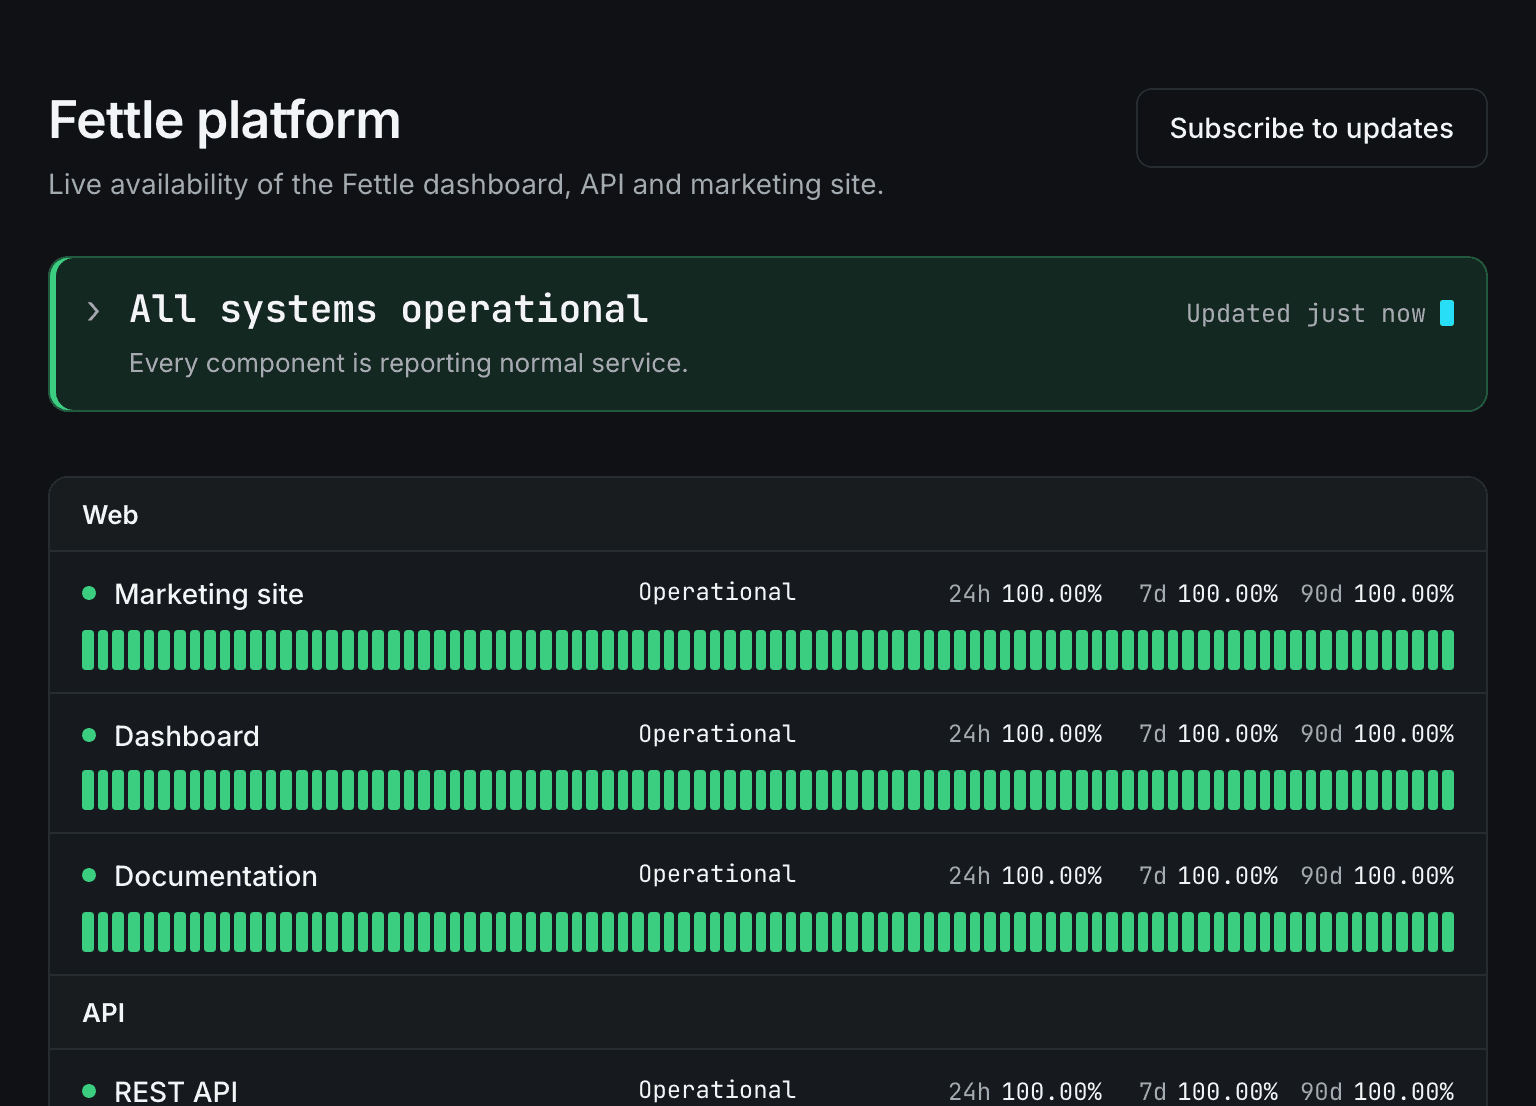
status.fettle.sh/fettle-platform ↗
Fettle public status page with 90 days of uptime history

/ free tools

Try before you sign up.

Free tools, no account needed. Same probes that power the paid product.

SSL checker→

Expiry, chain, hostname match — instant answer for any domain.

Is it down?→

Check any URL from Europe, US, and Asia at once — down for everyone, or just you?

Uptime calculator→

What 99.9% actually means in minutes of downtime per month.

/ features

Everything a developer needs. Nothing else.

Probes

  • HTTP, TCP, ping, DNS, SSL
  • Cron heartbeatsa job that missed its ping is an incident
  • Certificate expiry warnings

Alerting

  • Email, Telegram, Slack, Discord, webhooks
  • Ack & renotify
  • Maintenance windowsrecurring — weekly, monthly, in your org's timezone

Status pages

  • Public page on every plan
  • Subscriptions & incident updates
  • White-label on Max

API & workflow

  • REST API + keys on every plan
  • MCP serverofficial registry: sh.fettle/mcp
  • Teamsorganizations, invites, roles
  • Tags across monitors & heartbeats
  • Uptime badges for your READMEuptime100%

Guides for real setups — client sites, cron jobs, side projects: Use cases →

/ pricing

Free while you're small.
Honest when you grow.

Free is real — no card, not a trial.

Free

Perfect for personal projects and side experiments.

$0
  • 20 monitors · 3 min checks
  • Checks from 1 region
  • 1 status page
  • 3 heartbeats
  • 7 days history
  • API + MCP included

Plus

For indie devs going past the free tier.

$9/mo
  • 50 monitors · 1 min checks
  • Checks from 2 regions
  • 1 status page
  • 20 heartbeats
  • 90 days history
Most popular

Pro

For serious developers running production.

$19/mo
  • 100 monitors · 1 min checks
  • Checks from all regions
  • 3 status pages
  • 50 heartbeats
  • 180 days history

Max

For teams and agencies running infrastructure for clients.

$39/mo
  • 300 monitors · 30 sec checks
  • Checks from all regions
  • 10 status pages
  • 150 heartbeats
  • 1 year history
  • White-label status pages
Need more? Enterprise — unlimited everything, contact us.How we compare: UptimeRobot, Pingdom →
See full pricing →

Get your stack in fine fettle.

Free plan, no card — paste a URL, or let your agent do it.